Hello friends! As a continuation of my article about setting up Alerts 5, I consider it necessary to make a general analysis of useful software which you will need to make the validator always work.
Special thanks for important parts @p1xel32 ![]()
Here I will present how monitoring is performed using 3 utilities:
- 1st Part - Prometheus
- 2nd Part - Grafanacloud
- 3d Part - node exporter
- 4th Part - Dashborad setting up
- 5th Part - Conclusion
before we start - deploy and connecting to a new server
Update packages:
sudo apt update && sudo apt upgrade -y
Installing the file editor
apt install nano
Prometeus: 1. Create a dedicated user and group for Prometheus on your server
groupadd --system prometheus
useradd -s /sbin/nologin --system -g prometheus prometheus
1.2. Download the latest version of Prometheus
1.3 extract
tar -xvf prometheus*.tar.gz
1.4 change the directory to the extracted directory
cd prometheus-2.42.0.linux-amd64
1.5 create some required directories
mkdir /etc/prometheus
mkdir /var/lib/prometheus
1.6 copy the required files
mv prometheus.yml /etc/prometheus/prometheus.yml
mv consoles/ console_libraries/ /etc/prometheus/
mv prometheus promtool /usr/local/bin/
1.7 create a systemd service file
nano /etc/systemd/system/prometheus.service
add lines:
[Unit]
Description=Prometheus
Documentation= Overview | Prometheus
Wants=network-online.target
After=network-online.target
[Service]
Type=simple
User=prometheus
Group=prometheus
ExecReload=/bin/kill -HUP $MAINPID
ExecStart=/usr/local/bin/prometheus \
–config.file=/etc/prometheus/prometheus.yml \
–storage.tsdb.path=/var/lib/prometheus \
–web.console.templates=/etc/prometheus/consoles \
–web.console.libraries=/etc/prometheus/console_libraries \
–web.listen-address=0.0.0.0:9090 \
–web.external-url=
SyslogIdentifier=prometheus
Restart=always
[Install]
WantedBy=multi-user.target
1.8 Save and close the file then set proper ownership and permission to the Prometheus directory
chown -R prometheus:prometheus /etc/prometheus/
chmod -R 775 /etc/prometheus/
chown -R prometheus:prometheus /var/lib/prometheus/
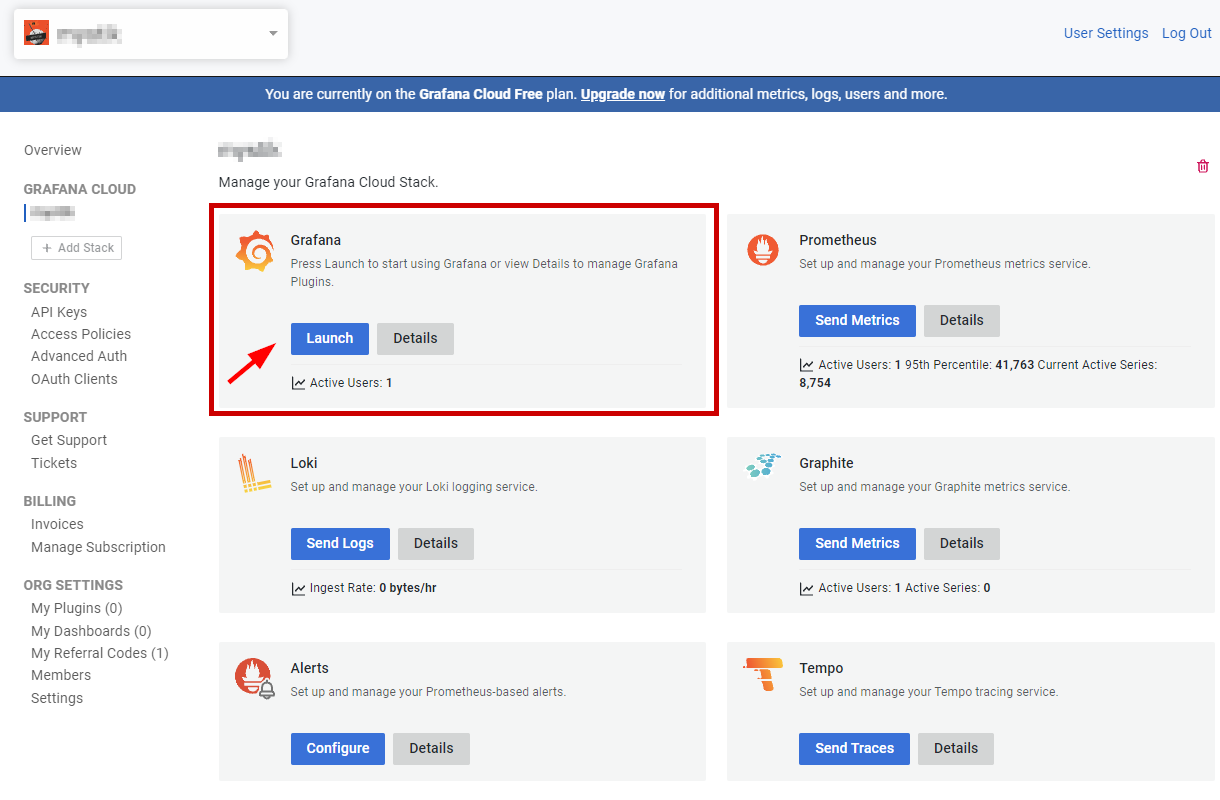
GrafanaCloud:
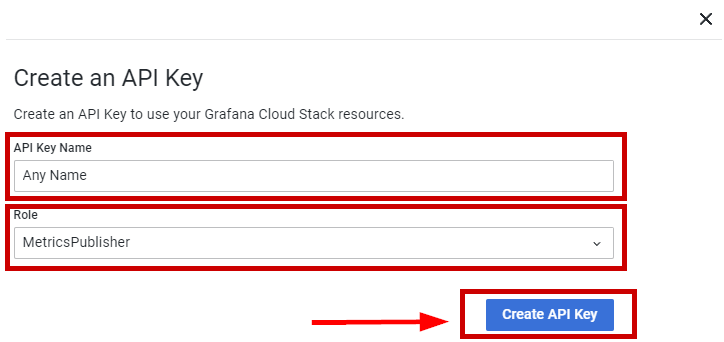
2 Create account and api keys grafana free service
Grafana Cloud 1
Welcome to Grafana Cloud
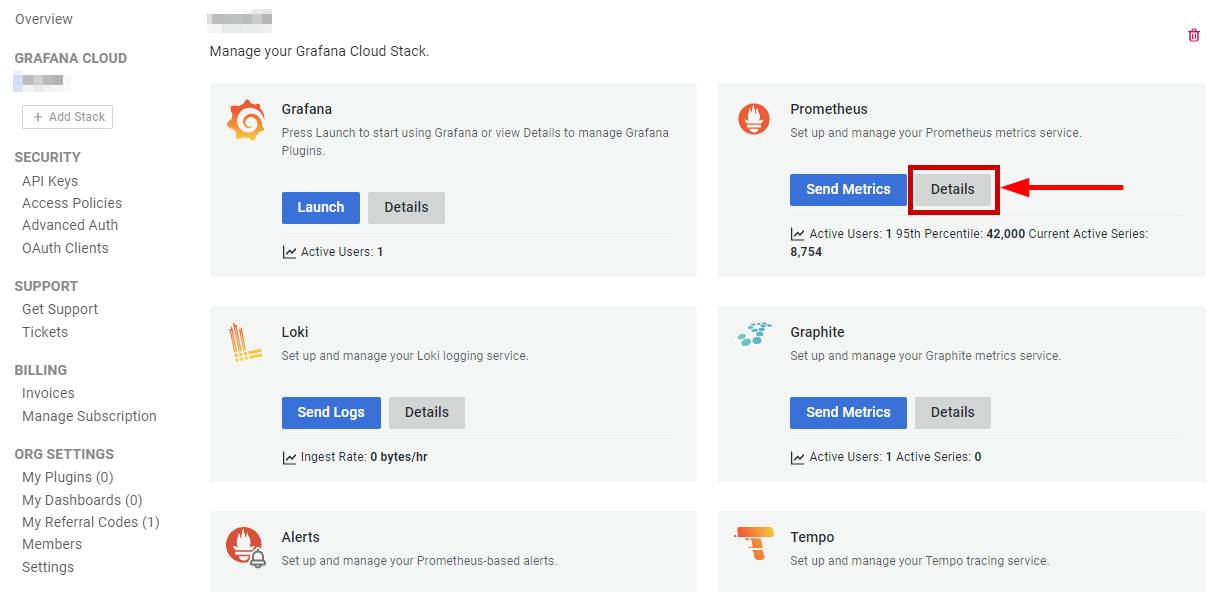
2.1 Head over to your Grafana Cloud Portal and select Send Metrics on Prometheus. If you scroll above, you should see the section for API Key.
Click on Generate now and create an API Key with the Role MetricsPublisher.
Copy the Prometheus config and save it locally. The url and username should be unique for every user.
The password in both snippet should be filled with your API key.


2.2 change prometheus config change url, password and username in config

nano /etc/prometheus/prometheus.yml
replace 5 lines by yours(origin_prometheus, url, username, password, job_name exporter targets) :
#Sample config for Prometheus.
global:
scrape_interval: 15s # Set the scrape interval to every 15 seconds. Default is every 1 minute.
evaluation_interval: 15s # Evaluate rules every 15 seconds. The default is every 1 minute.
#scrape_timeout is set to the global default (10s).
#external systems (federation, remote storage, Alertmanager).
external_labels:
monitor: ‘example’
origin_prometheus: AnyName
remote_write:
basic_auth:
username: 77777
password: AOHSDJASHDKASDUhkasjdhauKSADHausdhaskj
#Alertmanager configuration
alerting:
alertmanagers:
-
static_configs:
-
targets: [‘localhost:9093’]
#Load rules once and periodically evaluate them according to the global ‘evaluation_interval’.
rule_files:
#- “first_rules.yml”
#- “second_rules.yml”
#A scrape configuration containing exactly one endpoint to scrape:
#Here it’s Prometheus itself.
scrape_configs:
#The job name is added as a label job=<job_name> to any timeseries scraped from this config.
- job_name: ‘prometheus’
#Override the global default and scrape targets from this job every 5 seconds.
scrape_interval: 5s
scrape_timeout: 5s
#metrics_path defaults to ‘/metrics’
#scheme defaults to ‘http’.
static_configs:
-
targets: [‘localhost:9090’]
-
job_name: exporter
#If prometheus-node-exporter is installed, grab stats about the local
#machine by default.
static_configs:
-
targets: [‘localhost:9100’]
-
job_name: AnyName
static_configs:
- targets: [‘localhost:9101’]
2.3 Run prometheus:
systemctl daemon-reload
systemctl start prometheus
systemctl enable prometheus
- Next, go to the server where your node is installed and install Node Exporter:
3.1 Install and Configure node_exporter
3.2 extract
tar -xvzf node_exporter-1.5.0.linux-amd64.tar.gz
3.3 move the extracted directory to the /etc/prometheus/
mv node_exporter-1.5.0.linux-amd64 /etc/prometheus/node_exporter
3.4 set proper ownership
chown -R prometheus:prometheus /etc/prometheus/node_exporter
3.5 create a systemd service file
nano /etc/systemd/system/node_exporter.service
Add the following lines:
[Unit]
Description=Node Exporter
Wants=network-online.target
After=network-online.target
[Service]
User=prometheus
ExecStart=/etc/prometheus/node_exporter/node_exporter
[Install]
WantedBy=default.target
3.6 Run Node exporter
systemctl daemon-reload
systemctl start node_exporter
systemctl enable node_exporter
- Dashboard setting up

Now go to grafana.net → dashboard → import dashboard → import your desired dashboard + you can import exporter dashboard with the detailed server info for example 11074.
Also in that dashboard you can add any statistic about your node which was collected by prometheus.
Useful commands:
Check status
systemctl status prometheus
systemctl status node_exporter
Switch off prometheus and exporter
systemctl stop prometheus && systemctl disable prometheus
systemctl stop node_exporter && systemctl disable node_exporter
That’s all you need to monitor your node - please remember that alerts is really important part as well since need to instantly react on what’s happening on logs.
I hope that guide was helpful for you to understand what tools do you need to be aware of your validator health. Enjoy your day!